1. Data Preprocessing
1.1 Page Overview
FluNexus offers a preprocessing module for users to preprocess their own uploaded data on the Data Preprocessing page. The HA1 preprocessing panel offers three configurable options: (i) remove uncertain amino acids (e.g., B, Z, J, X), (ii) remove sequences with gaps at both ends, and (iii) remove sequences with high gap ratio. For HI data, FluNexus offers a menu to convert HI titers into antigenic distances.
1.2 Preparation (File formats)
HA1: *.fasta (segment of the influenza virus HA1 sequence).
Here is the download link for the example file.
HI: *.csv or *.xlsx
Here is the download link for the example file.
For the Excel format (*.xlsx), the file must follow the structure below:
Table title Viruses Other information Genetic group Collection date Passage history HK/1/1968 HK/107/1971 ... EN/42/1972 PC/1/1973 Passage history Ferret number Genetic group BI/15793/1968 354 * ... 501 109 BI/16190/1968 640 * ... 320 80 ... ... ... ... ... ... HK/1/1968 1280 1280 ... 2560 53 BI/808/1969 320 * ... 640 120 For the CSV format (*.csv), the file must follow the structure below:
virus HK/1/1968 HK/107/1971 ... EN/42/1972 PC/1/1973 BI/15793/1968 354 * ... 501 109 BI/16190/1968 640 * ... 320 80 ... ... ... ... ... ... HK/1/1968 1280 1280 ... 2560 53 BI/808/1969 320 * ... 640 120
1.3 Quick Start
Upload data
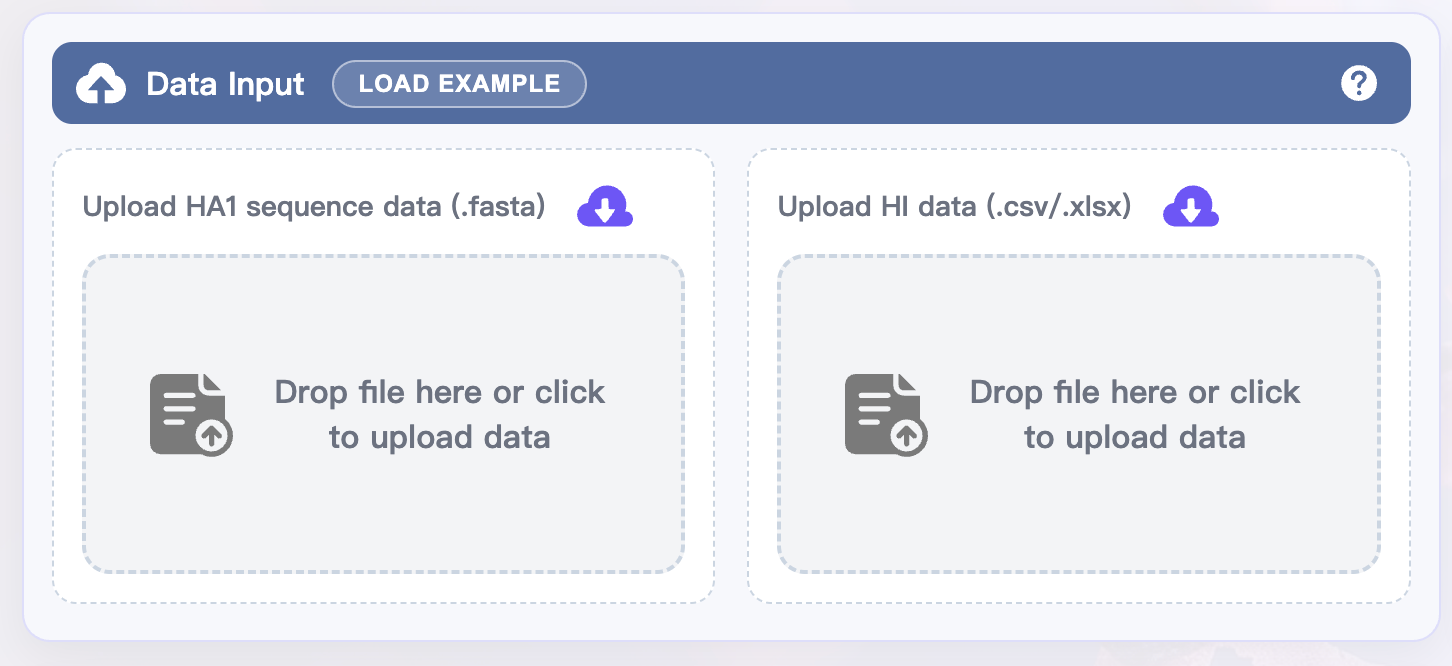
In the upper-left Data Input panel:
Drop your HA1 sequence data (.fasta) into the "Drop file or click to upload data" area, or click the area to select the file.
Drop your HI data (.csv or .xlsx) into the the "Drop file or click to upload data" area, or click the area to select the file.
Enable preprocessing
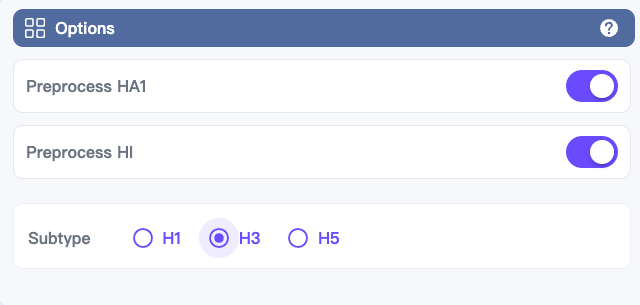
In the upper-right Options panel:
Toggle on the Preprocess HA1 and Preprocess HI switches.
Select the subtype of the HA1 sequences to be preprocessed.
Set preprocessing details
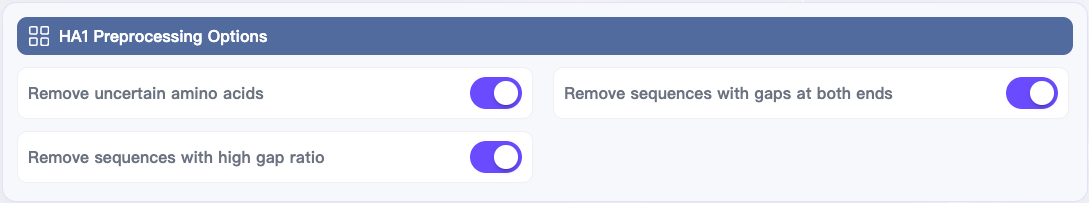
HA1 Preprocessing Options (bottom left):
Toggle the switches you need (recommended to enable all by default):
Remove uncertain amino acids
Remove sequences with high gap ratio
Remove sequences with gaps at both ends
HI Preprocessing Options (bottom right):
Select Distance type: NAD or AHD.
Execute and view results
Click EXECUTE at the bottom of the page to start preprocessing.
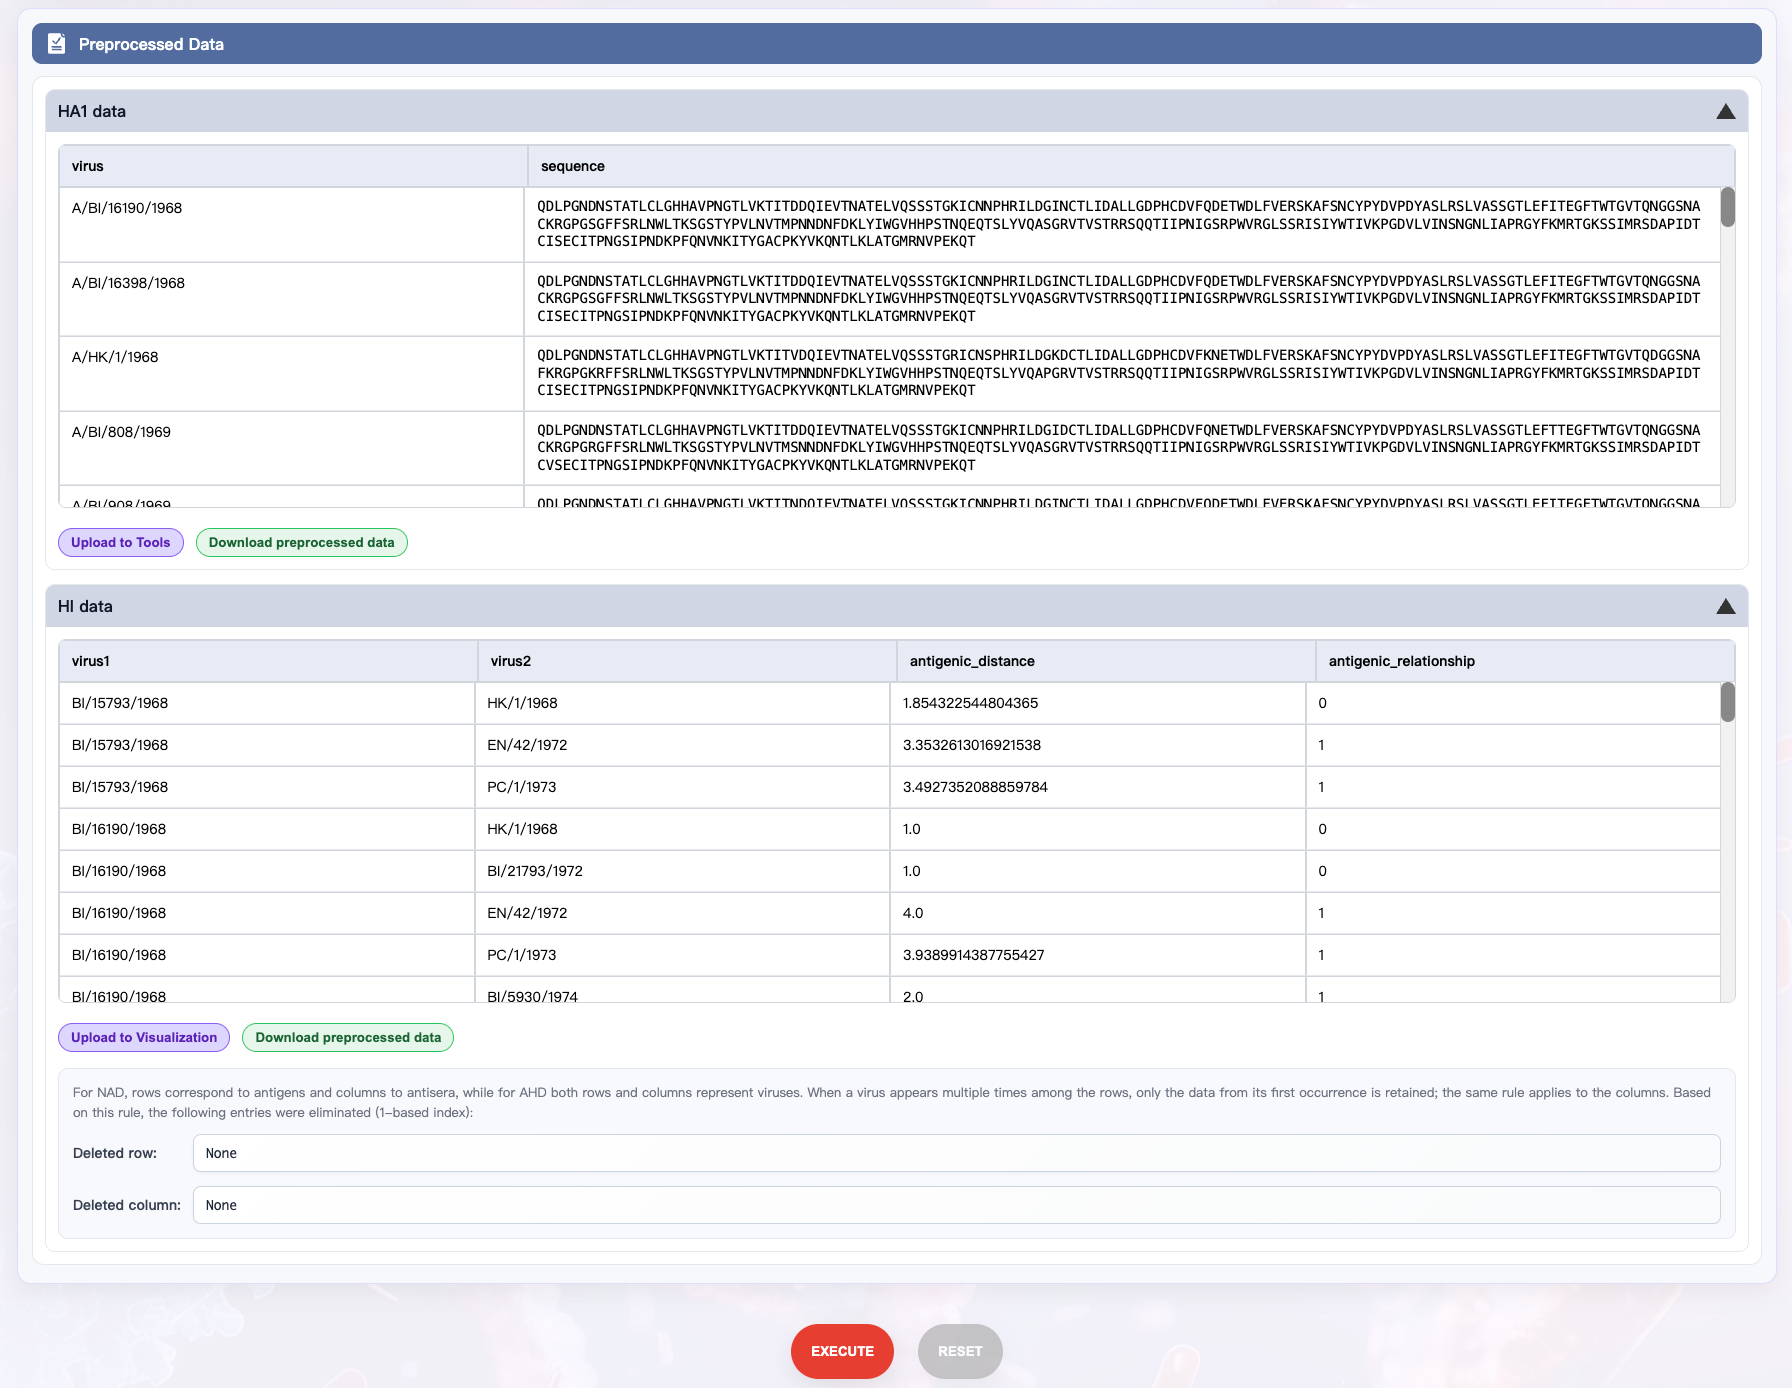
In the Preprocessed Data panel, expand HA1 data or HI data to view results (you can export the preprocessed data by clicking the Download preprocessed data button).
Example (optional)
If you don’t have data ready, click LOAD EXAMPLE at the top of the Data Input panel to automatically load demo data and execute the analysis.
Reset (optional)
If you need to start over, click RESET at the bottom of the page.
1.4 Detailed Module Description
1.4.1 Data Input
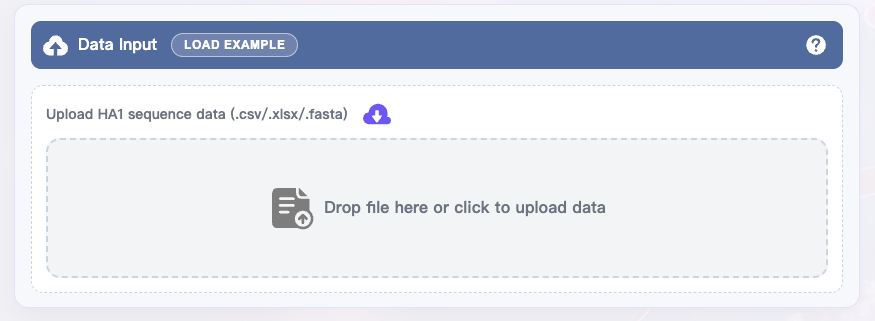
Upload HA1 sequence data (.fasta)
Upload HI data (.csv/.xlsx)
1.4.2 Options (Global Switches)
Preprocess HA1: Whether to preprocess HA1 sequences.
Preprocess HI: Whether to preprocess HI data.
Subtype: The subtype of the HA1 sequences to be preprocessed.
If you only want to test one data type (e.g., HA1 sequence only), you can enable only the corresponding switch.
1.4.3 HA1 Preprocessing Options
Remove ambiguous amino acids: Exclude sequences containing ambiguous amino acid codes (e.g., B, Z, J, X).
Remove sequences with high gap ratio: Exclude sequences with more than 10% gaps.
Remove sequences with gaps at both ends: Discard sequences that have gaps at both termini.
1.4.4 HI Preprocessing Options
Distance type: NAD / AHD
NAD: The Normalized Antigenic Distance.
AHD: The log2-transformed Archetti–Horsfall Distance.
1.4.5 Preprocessed Data
In the HA1 data:
virus: Name of the virus
sequence: Processed HA1 sequence
In the HI data:
virus1: Name of the first virus in the pair
virus2: Name of the second virus in the pair
antigenic_distance: Antigenic distance between the two viruses
antigenic_relationship: Antigenic relationship between the two viruses, where 1 indicates antigenic variant and 0 indicates non-antigenic variant
Note: When the distance type in the HI Preprocessing Options panel is set to NAD, virus1 represents the antigen and virus2 represents the antiserum.
1.4.6 Bottom Operation Buttons
EXECUTE: Run preprocessing pipeline (reads uploaded files and current settings).
RESET: Clear uploaded files and reset configuration.
1.5 FAQ
Q1: No output after execution?
Ensure at least one data type is uploaded and the corresponding preprocess switch is on.
Q2: HI table import failed or dimensions mismatch?
Ensure no merged cells; verify headers are clean; remove hidden spaces/full-width characters; save CSV in UTF-8.
Q3: Preprocess only HA1 or HI?
Yes. Upload and enable only the desired type’s Preprocess switch.
Q4: "Too many items! Allowed maximum is …" error?
The HA1 data is limited to 40,000 sequences, and HI data is limited to 40,000 HI titer entries. Please ensure your dataset does not exceed these limits.
2. Antigenic Prediction
2.1 Page Overview
On the Antigenic Prediction page in FluNexus, users can initiate an online analysis by uploading HA1 sequence data. The interface allows for the selection of specific computational tools, the designation of the virus subtype, and the choice between two types of antigenic distance.
2.2 Preparation
2.2.1 Options (File formats)
Here is the download link for the example file.
.csv / .xlsx – HA1 sequences in CSV and Excel format; typically includes columns for virus name and sequence. The required format is as follows:
(1) Virus pairs – Contains virus1, virus2, sequence1, and sequence2 columns.
virus1 virus2 sequence1 sequence2 BI/15793/1968 BI/16190/1968 QDLPGNDN...NVPEKQT QDLPGNDN...NVPEKQT BI/16190/1968 HK/1/1968 QDLPGNDN...NVPEKQT QDLPGNDN...NVPEKQT ... ... ... ... HK/1/1968 BI/15793/1968 QDLPGNDN...NVPEKQT QDLPGNDN...NVPEKQT BI/808/1969 BI/808/1969 QDLPGNDN...NVPEKQT QDLPGNDN...NVPEKQT (2) Virus set – Contains virus and sequence columns.
virus sequence BI/15793/1968 QDLPGNDN...NVPEKQT BI/16190/1968 QDLPGNDN...NVPEKQT ... ... HK/1/1968 QDLPGNDN...NVPEKQT BI/808/1969 QDLPGNDN...NVPEKQT Note: All viruses in the set will be combined in a Cartesian product to generate virus pairs.
.fasta – HA1 sequences in FASTA format; contains HA1 sequences with headers indicating virus names. The required format is as follows:
61>A/BI/2271/19762QDLPGNDNSTATLCLGHHAVPNGTLVKTITNDQIEVTNATELVQSSSTGRICNNPHRILDGINCTLIDALLGDPHCDGFQNKKWDLFVERSKAFSNCYPYDVPDYASLRSLVASSGTLEFINEGFNWTGVTQNGGSYACKRGPDNGFFSRLNWLYKSESTYPVLNVTMPNNDNFDKLYIWGVHHPSTDKEQTNLYVQASGRVTVSTKRSQQTIIPNVGSRPWVRGLSSRISIYWTIVKPGDILVINSNGNLIAPRGYFKIRNGKSSIMRSDAPIGTCSSECITPNGSIPNDKPFQNVNKITYGACPKYVKQNTLKLATGMRNVPEKQT3>A/BI/5029/19764QDLPGNDNSTATLCLGHHAVPNGTLVKTITNDQIEVTNATELVQSSSTGKICGNPHRILDGINCTLIDALLGDPHCDGFQNEKWDLFVERSKAFSNCYPYDVPDYASLRSLVASSGTLEFINEGFNWTGVTQNGGSSACKRGPDNGFFSRLNWLYKSGSTYPVQNVTMPNNDNSDKLYIWGVHHPSTDKEQTDLYVQASGKVTVSTKRSQQTVIPNVGSRPWVRGLSSRVSIYWTIVKPGDILVINSNGNLIAPRGYFKMRTGKSSIMRSDAPIGTCSSECITPNGSIPNDKPFQNVNKITYGACPKYVKQNTLKLATGMRNVPEKQT5>A/BI/5168/19766QDLPGNDNSTATLCLGHHAVPNGTLVKTITNDQIEVTNATELVQSSSTGKICDNPHRILDGINCTLIDALLGDPHCDGFQNEKWDLFVERSKAFSNCYPYDVPDYASLRSLVASSGTLEFINEGFNWTGVTQNGGSSACKRGPDNGFFSRLNWLYKSGSTYPVQNVTMPNNDNSDKLYIWGVHHPSTDKEQTDLYVQASGKVTVSTKRSQQTVIPNVGSRPWVRGLSSRVSIYWTIVKPGDILIINSNGNLIAPRGYFKMRTGKSSIMRSDAPIGTCSSECITPNGSIPNDKPFQNVNKITYGACPKYVKQNTLKLATGMRNVPEKQTNote: All viruses will be combined in a Cartesian product to generate virus pairs.
2.2.2 Sequence Requirements
All input virus sequences must meet the specified length for their subtype, and the amino acid positions must align with the reference sequence. Sequences that do not meet these requirements cannot be processed and will prevent the workflow from executing.
H1
Required length: 326 amino acids
Reference sequence:
A/Aichi/24/1992DTICIGYHANNSTDTVDTVLEKNVTVTHSVNLLEDSHNGKLCRLKGIAPLQLGNCSVAGWILGNPECESLFSKESWSYIAETPNPENGTCYPGYFADYEELREQLSSVSSFERFEIFPKESSWPNHTVTKGVTASCSHNGKSSFYRNLLWLTEKNGLYPNLSKSYVNNKEKEILVLWGVHHPSNIGDQRAIYHTENAYVSVVSSHYSRRFTPEIAKRPKVRDQEGRINYYWTLLEPGDTIIFEANGNLIAPWYRFALSRGFGSGIITSNASMDECDAKCQTPQGAINSSLPFQNVHPVTIGECPKYVRSTKLRMVTGLRNIPSIQS
H3
Required length: 328 amino acids
Reference sequence:
A/abidjan/456/2021QKIPGNDNSTATLCLGHHAVPNGTIVKTITNDRIEVTNATELVQNSSIGEICDSPHQILDGGNCTLIDALLGDPQCDGFQNKKWDLFVERSRAYSNCYPYDVPDYASLRSLVASSGTLEFKNESFNWAGVTQNGKSSSCIRGSSSSFFSRLNWLTHLNYTYPALNVTMPNKEQFDKLYIWGIHHPDTDKNQFSLYAQPSGRITVSTKRSQQAVIPNIGSRPRIRDIPSRISIYWTIVKPGDILLINSTGNLIAPRGYFKIQSGKSSIMRSDAPIGKCKSECITPNGSIPNDKPFQNVNRITYGACPRYIKQSTLKLATGMRNVPEKQT
H5
Required length: 317 amino acids
Reference sequence:
A/turkey/Italy/21VIR9510-1/2021DQICIGYHANNSTEQVDTIMEKNVTVTHAQDILEKTHNGKLCDLNGVKPLILKDCSVAGWLLGNPMCDEFIRVPEWSYIVERANPANDLCYPGSLNDYEELKHLLSRINHFEKILIIPKSSWPNHETSLGVSAACPYQGAPSFFRNVVWLIKKNDAYPTIKISYNNTNREDLLILWGIHHSNNAEEQTNLYKNPTTYISVGTSTLNQRLVPKIATRSQVNGQRGRMDFFWTILKPDDAIHFESNGNFIAPEYAYKIVKKGDSTIMKSGVEYGHCNTKCQTPVGAINSSMPFHNIHPLTIGECPKYVKSNKLVLATGL
2.3 Quick Start
Upload data Drop a file containing HA1 sequences into the "Drop file or click to upload data" area.
Choose parameters
In the right-hand Options:
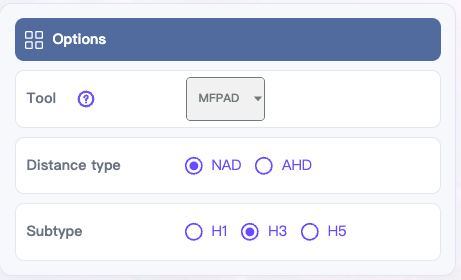
Tool:
MFPAD(Default),AdaBoost,PREDAC,PREDAC-CNN,CNN-M23,CNN-PSO,FluAttn,PN-AgEvaH1,IAV-CNN,PREDAC-TransformerDistance type:
NADorAHDSubtype:
H1,H3, orH5
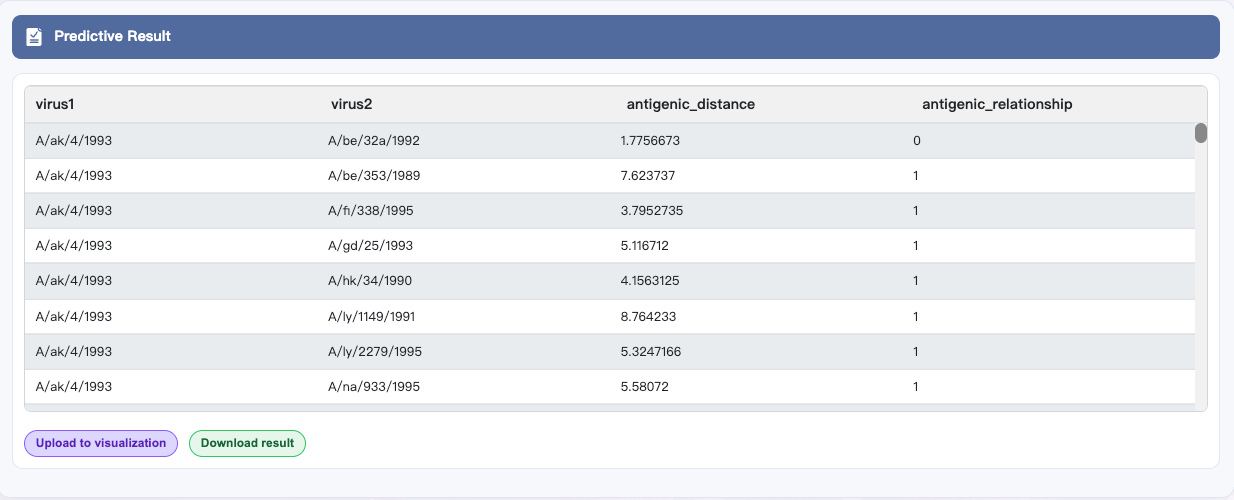
Run prediction and View results Click EXECUTE at the bottom to start antigenic distance prediction. After completion, results appear in Predictive Result. Click Download result to save.
Example (optional)
If you don’t have data ready, click LOAD EXAMPLE at the top of the Data Input panel to automatically load demo data and execute the analysis.
Reset (optional)
If you need to start over, click RESET at the bottom of the page.
2.4 Detailed Module Description
2.4.1 Data Input
Upload HA1 sequence data (.csv/.xlsx/.fasta)
2.4.2 Options (Parameter Settings)
| Parameter | Description | Default |
|---|---|---|
| Tool | Select the prediction model. Currently supports MFPAD, AdaBoost, PREDAC, PREDAC-CNN, CNN-M23, CNN-PSO, FluAttn, PN-AgEvaH1, IAV-CNN and PREDAC-Transformer | MFPAD |
| Distance type | Antigenic distance metric: NAD (The Normalized Antigenic Distance) or AHD (The log2-transformed Archetti–Horsfall Distance). | NAD |
| Subtype | H1, H3, or H5. | H3 |
2.4.3 Predictive Result
The result contains the following columns:
virus1: Name of the first virus in the pair
virus2: Name of the second virus in the pair
antigenic_distance (only available for regression models): Antigenic distance between the two viruses
antigenic_relationship: Antigenic relationship between the two viruses, where 1 indicates antigenic variant and 0 indicates non-antigenic variant
Note: After obtaining the inference results, click the Upload to visualization button to go to the visualization interface. NAD corresponds to the Antigenic map and AHD corresponds to the Antigenic cluster.
2.4.4 Bottom Action Area
EXECUTE: Run preprocessing pipeline (reads uploaded files and current settings).
RESET: Clear uploaded files and reset configuration.
2.5 FAQ
Q1: "Too many items! Allowed maximum is …" error?
The number of virus pairs is limited to 40,000. Please ensure your dataset does not exceed these limits.
Q2: Prediction failed or an error occurred?
Please make sure the uploaded files meet the required format, and that the virus sequences comply with the subtype-specific requirements.
3. Antigenic Map
3.1 Page Overview
The Antigenic Map page is designed for visualization. Maps can be constructed using either the proposed manifold-based method or the established Racmacs method, accepting HI data or NAD values as input.
3.2 Preparation (File formats)
The Antigenic Map supports two types of input data: Titer data and NAD distance data. Use the data type option to select the corresponding format.
Here is the download link for the example file.
Titer: *.csv (hemagglutination inhibition experimental data; row and column names should match antigen/antiserum identifiers).
In the file, each row represents an antigen and each column represents an antiserum. The required format is as follows:
| virus | HK/1/1968 | HK/107/1971 | ... | EN/42/1972 | PC/1/1973 |
|---|---|---|---|---|---|
| BI/15793/1968 | 354 | * | ... | 501 | 109 |
| BI/16190/1968 | 640 | * | ... | 320 | 80 |
| ... | ... | ... | ... | ... | ... |
| HK/1/1968 | 1280 | 1280 | ... | 2560 | 53 |
| BI/808/1969 | 320 | * | ... | 640 | 120 |
NAD distance: *.csv (contains virus1, virus2, and antigenic_distance columns).
| virus1 | virus2 | antigenic_distance |
|---|---|---|
| BI/15793/1968 | BI/16190/1968 | 1.1 |
| BI/16190/1968 | HK/1/1968 | 1.4 |
| ... | ... | ... |
| HK/1/1968 | BI/15793/1968 | 1.6 |
| BI/808/1969 | BI/808/1969 | 1.2 |
3.3 Quick Start
The control panel is on the right and contains four sub-tabs:
| Tab | Overview |
|---|---|
| Options | Configure plotting algorithm, data type, dimensionality, clustering parameters, etc. |
| Style | Adjust point size, color, opacity, etc. |
| Points | View groupings for antigens and sera |
| Job Info | View job ID, status, download/upload results, and notification settings |
The large white area on the left is the canvas for visualization; the antigenic map will render there after execution.
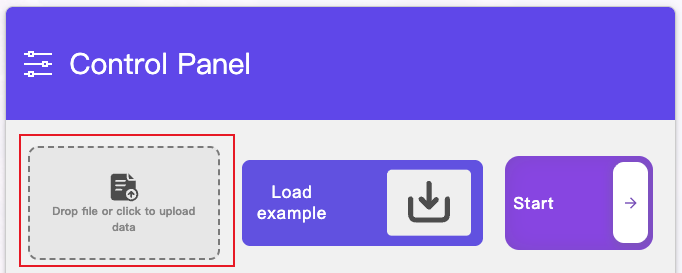
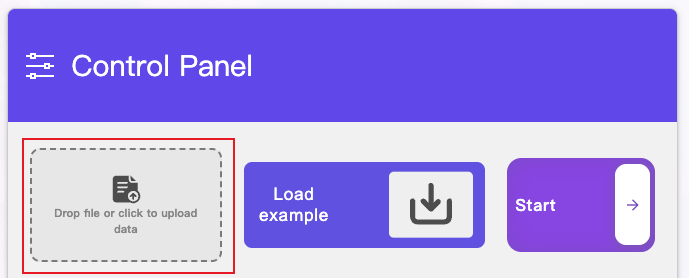
Upload data Drop the file into the "Drop file or click to upload data" area, or click to select a file.
Choose parameters
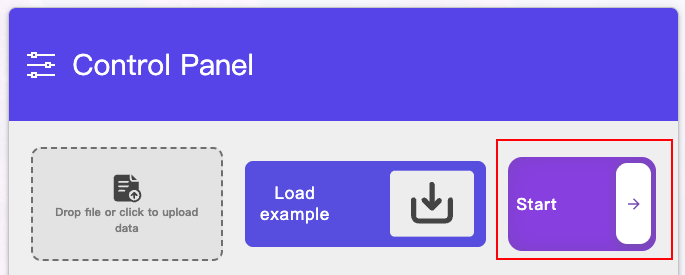
Click the Start button to execute the visualization task
Generate the antigenic map
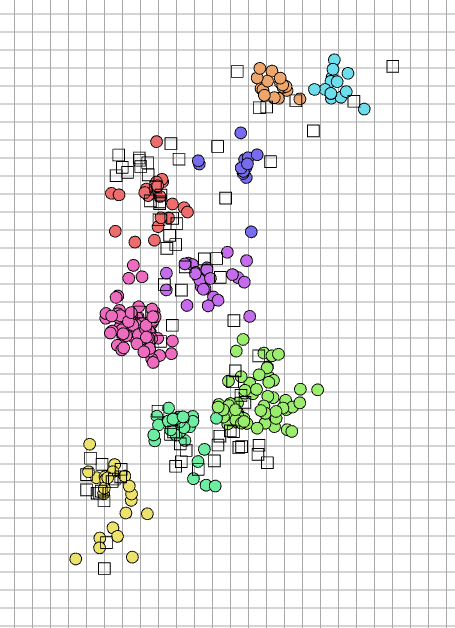
Under the default style settings, the visual elements in the antigenic map are defined as follows:
Symbols: antigens are visualized as circles (2D) or spheres (3D), whereas antisera are depicted as squares (2D) or cubes (3D).
Colors: points are colored to represent distinct antigenic groups identified by the k-means algorithm.
Axes: the axes represent the dimensions of the antigenic space (2D or 3D).
Grid: each grid interval represents 2 antigenic units, equivalent to a 4-folds change in HI titers.
3.4 Detailed Instructions
3.4.1 Upload & Load
▸ Upload file
Click the "Drop file or click to upload data" area to upload data for visualization.
▸ Load example
Click Load example to load built-in demo data for a quick walkthrough.
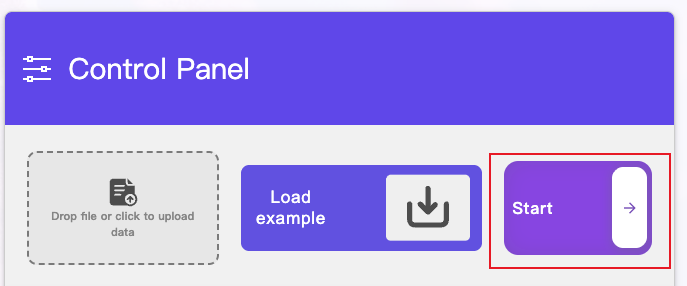
▸ Start job
Click Start (purple arrow button at the top right) to run the plotting task. After execution, check progress and results in the Job Info tab.
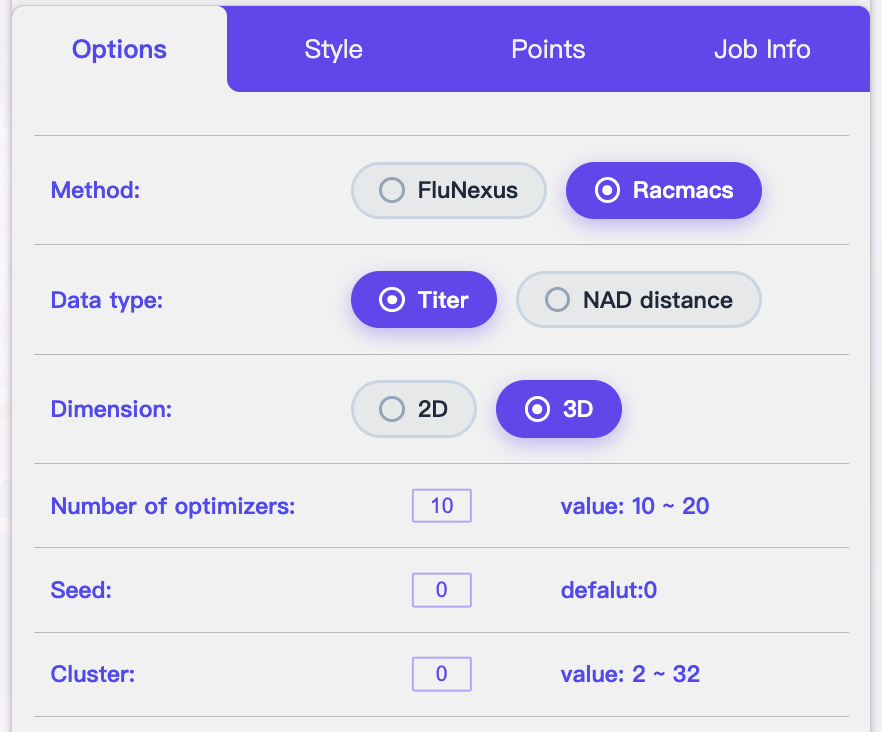
3.4.2 Options Tab: Plotting & Algorithm Settings
| Parameter | Description |
|---|---|
| Method | Select the visualization algorithm. Available options are FluNexus (default) and Racmacs. |
| Data type | Select input type: available options are Titer and NAD distance. |
| Dimension | Output dimensionality. Support 2D or 3D. |
| Number of optimizers | The number of optimizers |
| Seed | Random seed for reproducibility. |
| Cluster | The number of clusters. |
💡 Tips:
If the points are scattered chaotically, increase the number of optimizers.
Fix the Seed to obtain repeatable results.
3.4.3 Style Tab: Visual Styling
The Style Tab controls the coordinate system and point appearance. Key parameters:
| Parameter | Function |
|---|---|
| Show names | Toggle the display of names for all points on the antigenic map. |
| Style Settings | Configure label styles for all names, including font size, color, and other formatting options. |
| Apply to | Choose the target for styling: All / Antigens / Sera. |
| Shape | Select point shape. |
| Coordinate scale | Coordinate scale defines the scale division of the coordinate system, i.e., how much antigen distance one grid unit represents. A scale value of s indicates that s grid cells correspond to one unit of antigenic distance. For example, scale = 1 means each grid cell corresponds directly to one antigenic distance unit, whereas scale = 2 means two grid cells represent one antigenic distance unit. |
| Point scale | Control point size. |
| Point opacity | Control point transparency (0–1). |
| Outline width | Control outline width. |
| Point color | Choose point color. |
3.4.4 Points Tab: Point-set Information
This tab lists two types of elements:
Antigens
Sera
Click any item to highlight the corresponding entity on the canvas on the left.
In addition, hold Ctrl and click points on the antigenic map to select multiple points simultaneously.
3.4.5 Job Info Tab: Job & Result Management
| Field | Description |
|---|---|
| Notification email | Receive an email notification when the job finishes. |
| Download Metadata | Download the current job’s metadata files. |
| Upload Metadata | Load previously saved metadata from local files. |
💡 Note:
For long-running jobs, we recommend providing an email address to receive completion notifications automatically.
3.5 FAQ
Q1: No response when clicking Start
Check whether data has been uploaded or the example has been loaded.
Q2: Job unresponsive for a long time
Please check the following:
Parameter Match: Ensure the Data type selected in Options matches your uploaded file.
File Format: Verify the file format is correct and free of formatting errors.
Complexity: If the dataset is large, reduce the Number of optimizers to speed up calculation.
For large datasets, we recommend providing a Notification email in the Job Info tab before clicking Start to receive the generated map via email upon completion.
Q3: "Too many items! Allowed maximum is …" error?
The number of virus pairs is limited to 40,000, and HI data is limited to 40,000 HI titer entries. Please ensure your dataset does not exceed these limits.
4. Antigenic Cluster
4.1 Page Overview
The Antigenic Cluster page is designed for visualization. FluNexus constructs an antigenic correlation network where antigenic relationships are quantified by AHD distance.
4.2 Preparation (File formats)
The Antigenic Cluster supports three types of input data: Titer data, AHD distance data and Relationship data. Use the data type option to select the corresponding format.
Here is the download link for the example file.
Titer: *.csv (hemagglutination inhibition experimental data; row and column names should correspond to the same virus identifiers).
In the file, each row represents an antigen and each column represents an antiserum. The required format is as follows:
| virus | HK/1/1968 | HK/107/1971 | ... | EN/42/1972 | PC/1/1973 |
|---|---|---|---|---|---|
| BI/15793/1968 | 354 | * | ... | 501 | 109 |
| BI/16190/1968 | 640 | * | ... | 320 | 80 |
| ... | ... | ... | ... | ... | ... |
| HK/1/1968 | 1280 | 1280 | ... | 2560 | 53 |
| BI/808/1969 | 320 | * | ... | 640 | 120 |
AHD distance: *.csv (contains virus1, virus2, and antigenic_distance columns).
| virus1 | virus2 | antigenic_distance |
|---|---|---|
| BI/15793/1968 | BI/16190/1968 | 1.0 |
| BI/16190/1968 | HK/1/1968 | 1.1 |
| ... | ... | ... |
| HK/1/1968 | BI/15793/1968 | 1.9 |
| BI/808/1969 | BI/808/1969 | 1.3 |
Relationship: *.csv (contains virus1, virus2, and antigenic_relationship columns).
| virus1 | virus2 | antigenic_relationship |
|---|---|---|
| BI/15793/1968 | BI/16190/1968 | 0 |
| BI/16190/1968 | HK/1/1968 | 0 |
| ... | ... | ... |
| HK/1/1968 | BI/15793/1968 | 1 |
| BI/808/1969 | BI/808/1969 | 0 |
4.3 Quick Start
The control panel is on the right and contains four sub-tabs:
| Tab | Overview |
|---|---|
| Options | Configure the data type |
| Style | Adjust point size, color, opacity, etc. |
| Points | View Points |
| Job Info | View job ID, status, download/upload results, and notification settings |
The large white area on the left is the canvas for visualization; the antigenic cluster will render there after execution.
Upload data Drop the file into the "Drop file or click to upload data" area, or click to select a file.
Choose the data type

Click the Start button to execute the visualization task
Generate the antigenic cluster
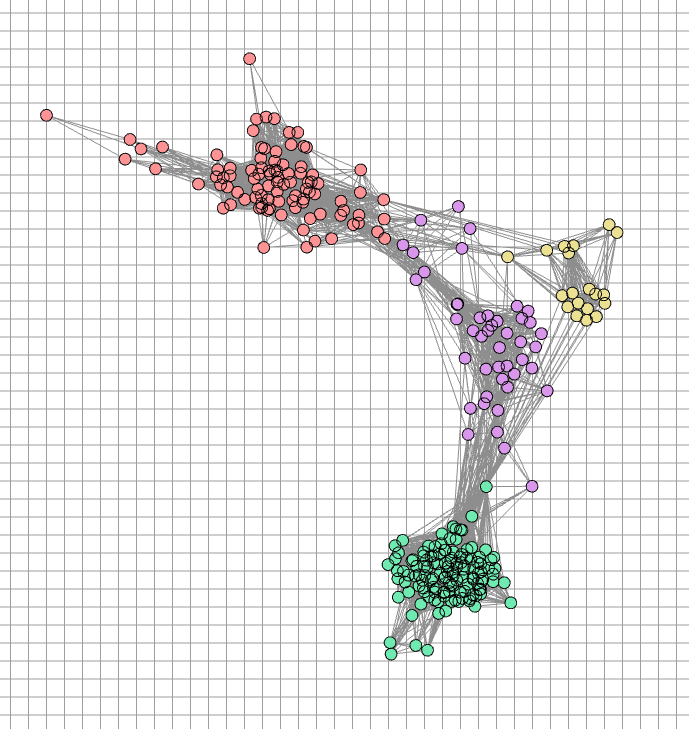
Under the default style settings, the visual elements in the antigenic cluster are defined as follows:
Symbols: virused are visualized as circles (2D).
Colors: points are colored to represent distinct antigenic groups identified by the Markov Clustering algorithm.
Axes: the axes represent the dimensions of the antigenic space (2D).
4.4 Detailed Instructions
4.4.1 Upload & Load
▸ Upload file
Drop the file into the "Drop file or click to upload data" area, or click to select a file for visualization.
▸ Load example
Click Load example to load built-in demo data for a quick walkthrough.
▸ Start job
Click Start (purple arrow button at the top right) to run the plotting task. After execution, check progress and results in the Job Info tab.
4.4.2 Options Tab
This tab configures basic plotting parameters:
| Parameter | Description |
|---|---|
| Data type | Select input type: available options are Tite, AHD distance and Relationship. |
4.4.3 Style Tab: Visual Styling
Adjust the appearance of points and axes to better present and differentiate antigens.
| Parameter | Description |
|---|---|
| Show names | Toggle the display of names for all points on the antigenic map. |
| Style Settings | Configure label styles for all names, including font size, color, and other formatting options. |
| Shape | Select point shape. |
| Coordinate scale | Scale the coordinate system. |
| Point scale | Control point size. |
| Point opacity | Control point transparency (0–1). |
| Outline width | Control outline width. |
| Point color | Choose point color. |
| Outline color | Choose outline color. |
4.4.4 Points Tab: Point-set Information
This tab lists the point sets in the current map. Click any item to highlight the corresponding entity on the canvas to the left.
4.4.5 Job Info Tab (Status & Management)
| Field | Description |
|---|---|
| Notification email | Receive an email notification when the job finishes. |
| Download Metadata | Download the current job’s metadata files. |
| Upload MetaData | Load previously saved metadata from local files. |
💡 Note:
For long-running jobs, we recommend providing an email address to receive completion notifications automatically.
4.5 FAQ
Q1: No response when clicking Start
Check whether data has been uploaded or the example has been loaded.
Q2: Job unresponsive for a long time
Please check the following:
Parameter Match: Ensure the Data type selected in Options matches your uploaded file.
File Format: Verify the file format is correct and free of formatting errors.
Complexity: If the dataset is large, reduce the Number of optimizers to speed up calculation.
For large datasets, we recommend providing a Notification email in the Job Info tab before clicking Start to receive the generated map via email upon completion.
Q3: "Too many items! Allowed maximum is …" error?
The number of virus pairs is limited to 40,000, and HI data is limited to 40,000 HI titer entries. Please ensure your dataset does not exceed these limits.